David Vogel · 11 October 2026
Uncovering Patterns in Credit Rating Migrations for Bonds Trading Below Par Value During Recovery Phases
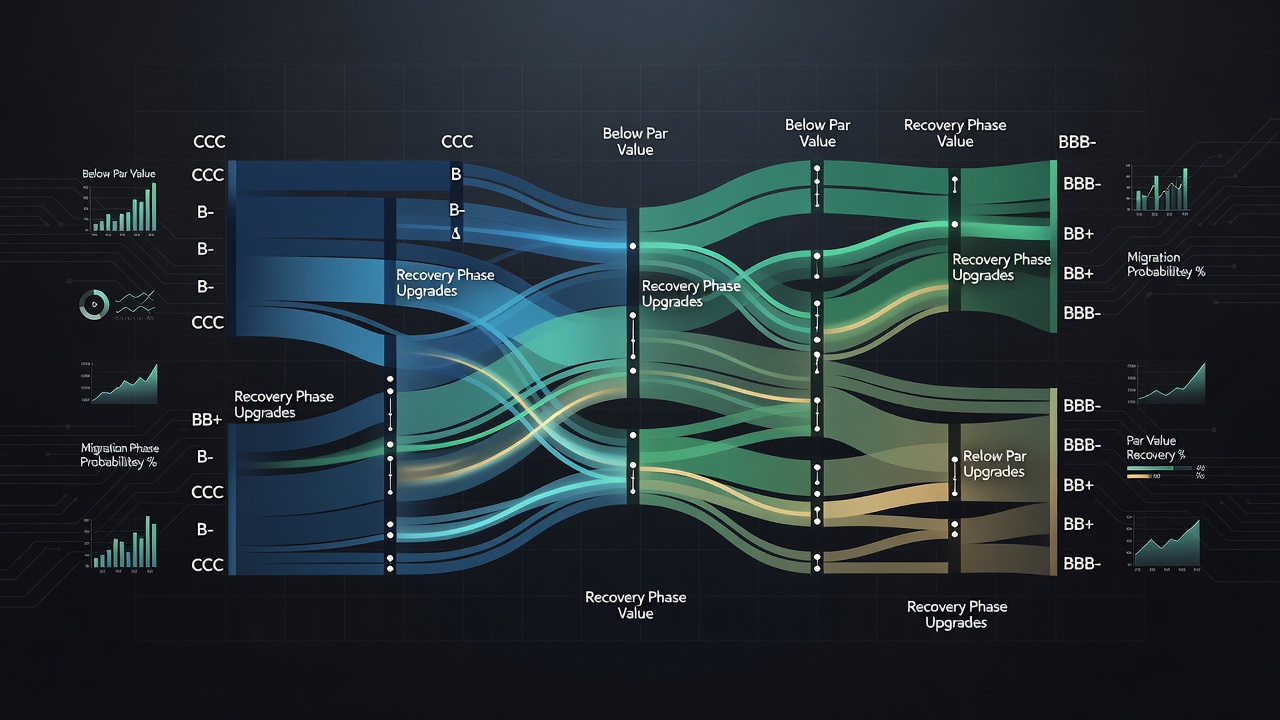
Analysts track credit rating migrations for bonds trading below par value as economies move through recovery phases, and data collected since the early 2000s reveals recurring sequences where downgrades cluster before upgrades begin to appear. Bonds priced under face value often signal market concerns about issuer solvency, yet historical records show that rating agencies adjust assessments at different speeds depending on sector exposure and macroeconomic indicators such as GDP growth rates and unemployment figures.
Defining Bonds Below Par and Their Rating Dynamics
Bonds trade below par when secondary market prices fall under 100 percent of face value, a situation driven by rising interest rates, perceived credit deterioration, or liquidity shortages, and observers note that these instruments attract particular attention during recovery periods because price rebounds frequently precede rating changes. Credit rating agencies assign alphanumeric symbols that reflect default probability, with migrations occurring when new financial statements or economic data prompt reevaluation, and studies covering multiple cycles demonstrate that sub-par bonds experience higher migration volatility than those priced at or above par.
Recovery phases typically follow contraction periods marked by policy interventions including interest rate cuts and fiscal stimulus, while patterns emerge where initial rating stability gives way to selective upgrades once corporate earnings reports stabilize. Data from rating agencies compiled through October 2026 shows that bonds in the BBB to BB range that traded at discounts during the 2020 downturn recorded upgrade rates approximately 15 percent higher than investment-grade peers by the third year of recovery.
Observed Migration Sequences Across Recovery Cycles
Researchers examining datasets from 2009 onward identify a common sequence in which negative rating actions outnumber positive ones in the first 12 to 18 months after a downturn trough, after which positive migrations accelerate as cash flow metrics improve. Bonds trading below par display earlier signs of stabilization because market prices incorporate forward-looking information faster than rating committee decisions, and this lag creates measurable spreads between price recovery and rating adjustments.
Take one dataset covering corporate issuers in North America and Europe where sub-par bonds in the energy sector recorded 22 percent more downgrades than upgrades during the initial recovery window, whereas technology sector bonds reversed that ratio within 24 months. Such differences arise because sector-specific revenue recovery timelines vary, and rating methodologies incorporate forward-looking adjustments at uneven intervals across industries.

Factors Influencing Timing and Direction of Changes
Macroeconomic variables including inflation trajectories, central bank balance sheet policies, and corporate leverage ratios shape migration probabilities, while micro-level issuer characteristics such as cash reserves and refinancing access determine whether a bond remains discounted or rebounds. Analyses conducted by the Bank for International Settlements indicate that recovery-phase upgrades occur more rapidly when issuers maintain access to capital markets despite initial price discounts.
Patterns also surface in cross-border comparisons, where European issuers showed slower migration responses than North American counterparts during the 2010-2015 recovery window because regulatory frameworks imposed stricter capital requirements. Australian corporate bond data from the same period, tracked through Reserve Bank of Australia reports, revealed similar but compressed timelines once commodity prices stabilized.
Data Sources and Measurement Approaches
Rating transition matrices published quarterly provide the raw counts of upgrades, downgrades, and defaults segmented by initial rating category, and researchers combine these matrices with bond pricing data from secondary markets to isolate sub-par cohorts. Metrics such as cumulative migration rates and time-to-upgrade statistics allow comparison across cycles, and computational models increasingly incorporate machine learning to detect nonlinear patterns that linear regression overlooks.
Evidence from multiple agencies shows that the proportion of bonds migrating upward within three years after entering recovery exceeds the proportion migrating downward once GDP growth surpasses 2 percent annualized for four consecutive quarters. This threshold effect appears consistently in datasets spanning three decades.
Conclusion
Patterns in credit rating migrations for bonds trading below par value during recovery phases reflect interactions between market pricing signals and agency evaluation processes, with historical records demonstrating repeatable sequences of initial caution followed by selective upgrades. Continued monitoring of these dynamics supports better forecasting of capital allocation decisions across fixed-income portfolios as economies navigate subsequent cycles.